|
Here's the first post in what was my longest series for SwiftEconomics.com. I break down all of those lies, damned lies and statistics (and by the way, I turned it into a short book too if you're interested). The first post is a primer on the subject as well as a bit on income inequality (and how's it's misused). Enjoy! Next in Series: Part 2: Income Stagnation ___________________________________________________________________________________________________ In my younger days I used to take every statistic I heard for granted. They were simply divine facts showered upon me by some metaphysical, knowledge fountain of truth. The idea that statistics are somehow infallible is almost ingrained in all of us from an early age. They relay a fact, and you can’t argue with a fact, can you? Statistics are everywhere, from polling to science to sports to economics. They make up one leg in any sound, logical argument. The other two components are a theory and at least one example. All three of these are important, yet all three can, and often are, faulty or manipulated. The last two we know can be incorrect, the first is trickier. Let’s start with theory. By definition, since multiple theories can describe the same phenomena, they can not all be correct. Keynesian economics and Austrian economics both describe how an economy functions; either one can be correct or they could both be wrong, but they both cannot be right. Therefore, we know to look for logical fallacies and alternative explanations to undermine each theory’s conclusions. Examples are important, but they can be just as misleading. In fact, sometimes they are all but useless. One recalls Al Gore showing a picture of an elderly lady in a 2000 presidential debate and describing how she was struggling financially, thus the need to put social security in the much maligned “lock box.” One has to ask whether this case really representative of the other 300 million some Americans. Healthcare reform proponents give examples of patients who were turned down for care and later died or suffered debilitating illnesses. Healthcare reform opponents discuss cases where rationed care caused patients to die waiting in line. Examples can prove just about anything (or more appropriately, just about nothing). Take the example of one very particular person and even the state lottery may seem like a wise investment. Usually, examples are meant to do little more than put a human face to the problem at hand; tug at the heartstrings, so to speak. Most people are affected by these sorts of examples, but most people can also see what’s going on when they step back from the issue. Statistics are often seen as infallible, though. Unfortunately, the truth is statistics are often very difficult to gather and compute in a methodologically sound way. Furthermore, there are a host of reasons a particular group may want to fudge these numbers. If anything, I hope this series will shine some light on how statistics can be flawed, and perhaps raise some healthy skepticism. For example, I remember local commercials being run, back when I was a young lad, which said several thousand people in my community go hungry every night. That sounded horrible and made me want to donate money to help feed them. According to Thomas Sowell, however, the statistic was “…determined [by] how many people were officially eligible for food stamps then subtracting those who in fact received food stamps.” (1) The absurdity of this methodology need not be elaborated on, but I’m going to do so anyways. I was recently unemployed and therefore eligible for food stamps. I guess I was going hungry every night without even knowing it! And this is how these things commonly go. Regardless of the motives, if you can find, or create a statistic, especially a shocking one, you have added a lot of substance to your argument. And if the subject of this statistic is sensitive, all the better. Who, after all, is going to criticize you for trying to feed starving people? It’s not just that many statistics are derived from faulty methodology, like the previous example, often the conclusions a statistic supposedly reveals are drenched with logical fallacies. Common ones here include post hoc ergo propter hoc (since event b followed event a, event a caused event b). Or in a similar vein, assuming correlation equals causation. For example, life expectancies have gone up rapidly in the last century, which coincides with global warming. Thereby, global warming increases life expectancies. This one is obviously wrong, however, in other cases people will use statistics to come to just as egregiously incorrect conclusions; the only difference is they “sound” right. With any correlative relationship, it is critical to look for what statisticians call the ‘lurking variable.’ In other words, an alternative explanation for whatever outcome took place. Take the fact that income inequality has increased in the United States since 1980 (there is actually some dissent to this view among economists, (2) and income stagnation is a statistical myth, to be discussed in the next entry of this series). Obviously, the increased inequality was caused by Ronald Reagan, the Washington Consensus and other politician’s decisions to liberalize the economy. Paul Krugman and Noam Chomsky have certainly said so.
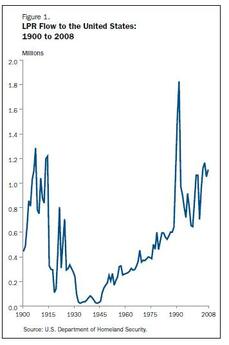
Was it really though? Immigration policies were also loosened drastically in the 1960’s, causing many more unskilled laborers to enter the country thereby depressing labor markets, especially at the lower end of the spectrum. Many more women entered the workforce as well. Given that men and women will usually marry people who are of similar education and income potential: i.e. typically an affluent man marries an affluent woman, a poor man marries a poor woman. When you put two high earners together (say $50,000/year) and two low earners (say $20,000), income inequality increases in real terms (the combined income is now $100,000 to $40,000 or the difference increases from $30,000 to $60,000), although percentage wise, it stays the same. (3) Technological changes can bring this about as well. Musicians used to have a fairly safe profession. There were gigs all over the place. Then some asshole invented a way to record music and all of a sudden the celebrity culture was born. On the one hand you have Beyoncé and Justin Timberlake making tens of millions of dollars. On the other, you have some down-and-out garage band trying to sell CDs they burned at home, after a concert they played in some hole-in-the-wall bar on a Friday night to a bunch of disinterested yuppies. Innovation and technology are great, but they can create inequality, and we’ve had plenty of innovation in the last century. (5) Finally, the degree to which our economy has been liberalized has been greatly exaggerated (see here and here). Government spending is actually higher as a percentage of GDP now than it was in 1979, (6) significantly undermining Krugman’s and Chomsky’s conclusion. But alas, a discussion on income inequality deserves another article entirely. The point here is that there are a multitude of factors that can influence any given statistic, poll result, trend or Gaussian bell curve. Even when the explanatory variable appears to describe what the statistic appears to show, be careful… Be very careful. It is with that spirit that I will delve into an array of statistics many of us simply take for granted. Have incomes stagnated over the past 30 years? Do all fiat currencies hyperinflate? What is the real death toll in Iraq? Is the gap between the number of women and men going to college a major problem? Do women really earn only 75 cents on the dollar for the exact same work as a man? Should Roger Maris have had an asterisk next to his name for his record-breaking 61 home runs in 1961 (since broken multiple times, albeit with an assist from HGH)? There are plenty of other statistics out there begging to be undermined. And feel free to email me if there’s a questionable one you’d like my two cents on. The point here is not to say that all forms of argument are flawed or that we can’t really know anything. This is not literary deconstruction applied to statistics.* The point is to emphasize that like theories and examples, statistics are fallible, very fallible indeed. Mark Twain, as he so often did, put it best: “There are three kinds of lies; lies, damn lies and statistics.”** __________________________________________________________________________________________________ Lies, Damned Lies and Statistics Series Part 1: A Primer Part 2: Income Stagnation Part 3: All Fiat Currencies Fail Part 4: Iraq War Casualties Part 5: Female-Male College Gap Part 6: Male-Female Wage Gap Part 7: Roger Maris’ Asterisk Part 8: Women Do All the Work but Men Keep All the Money Part 9: The BMI Part 10: A College Degree is Worth One Million Dollars __________________________________________________________________________________________________ *Deconstructionists basically go through a document or argument and then try to play it against itself to prove it is actually self-contradictory. They do this in some inane attempt to prove that reality is a social construct and there is no such thing as truth or logic. Ironically, using logic to prove there is no logic is just kinda, sorta begging the question (hey, perhaps they’re using some sort of postmodern mysticism to prove there’s no logic). Deconstructionists are typically leftists. They often reinterpret old texts to fit some political agenda. Deconstructionists can discover that a late 18th century book on basic economics is actually a series of logical contradictions designed to oppress the poor at the behest of bourgeoisie. Or a mid-19th century book on the science of botany is actually a social construct designed to keep women pregnant, barefoot and in the kitchen. Of course, we could then just deconstruct the deconstructions to prove that these leftist interpretations are actually a social construct. Then we could deconstruct the deconstructions of deconstructions to discover that the discovery that the leftist interpretations are social constructs is also nothing more than a social construct, reductio ad absurdum. In summary, deconstructionism is itself self-contradictory and is little more than uppity, elitist, intellectual nonsense. **OK, British Prime Minister Benjamin Disraeli was the first to say this. But nobody cares who he is, so we’ll just go with Mark Twain. (1) Thomas Sowell, The Vision of the Annointed, Pg. 45-46, Basic Books, Copyright 1995 (2) One dissenter to this view is Alan Reynolds of the Cato Institute. See Alan Reynolds, “Has U.S. Income Inequality Really Increased, Cato Policy Analysis no. 586, January 8, 2007, Cato Institute, http://www.cato.org/pub_display.php?pub_id=6880 (3) For a longer discussion on alternative causes for growing income inequality, see Brink Lindsey, “Nostalgianomics: Liberal economists pine for days no liberal should want revisit,” Reason Magazine, June 2009, http://www.reason.com/news/show/133222.html (4) Annual Flow Report, March 2009, Office of Immigration Statistics, Department of Homeland Security, http://topforeignstocks.com/wp/wp-content/uploads/2009/08/gc-growth.JPG (5) For a discussion on how technology can increase inequality, see Nassim Nicholas Taleb, The Black Swan, specifically pg 26-37, Random House Publishing Group, Copyright 2007 (6) Christopher Chantrill, “US Government Spending as a Percent of GDP,” US Government Spending.com, Retrieved 8/14/09, http://www.usgovernmentspending.com/index.php
Comments
|
Andrew Syrios"Every day is a new life to the wise man." Archives
August 2018
Blog Roll
Bigger Pockets REI Club Tim Ferris Joe Rogan Adam Carolla MAREI Worcester Investments Entrepreneur The Righteous Mind Star Slate Codex Mises Institute Tom Woods Consulting by RPM Swift Economics Categories |


 RSS Feed


